Grouping
Data that is returned from a filter can be aggregated by one or more columns. For example, a list of Azure/Entra license assignments can be grouped by license ID to return a count of how many users are assigned to each license.
Grouping is particularly useful for generating reports. These reports can be sent out as an email or can be the basis for a reporting dashboard.
Note
Grouping is most effective for datasets that contain repeated values, often because the data represents one-to-many or many-to-many relationships. Examples include license assignments, group memberships, and employee-to-department assignments.
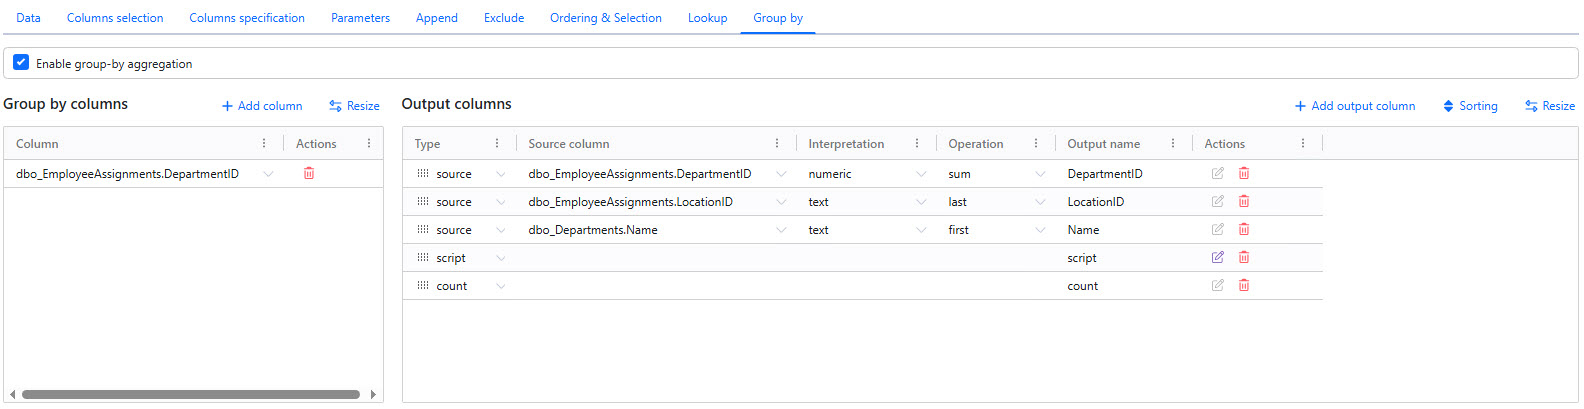
The grouping feature is accessible by the Group By tab at the bottom of the filter configuration window. To enable it, select the Enable group-by-aggregation checkbox.
Group By Columns
Columns added to the Group By Columns section are used by NIM to aggregate the data returned by the filter.
When grouping is enabled, you must add at least one column to this section. Available columns are those returned by the filter, as well as any custom JavaScript columns that you have added under the Column Specifications tab.
To add a new Group By column, click +Add Column.
To remove a Group By column, click its  icon.
icon.
Output Columns
Columns added to the Output Columns section define what columns of data NIM returns when the filter is executed. The columns in this section replace the columns that are selected in the Column Selection tab. The name of each column is defined by its output name value, which can be overridden.
When grouping is enabled, you must add at least one output column to this section.
To add a new Output Column, click +Add Column.
To remove an Output Column, click its icon.
Column Types
Each output column has a column type dropdown that offers the following options: source, count, and script.
Source columns allow you to select a value in the source column dropdown. Available columns are those returned by the filter, as well as any custom JavaScript columns that you have added under the Column Specifications tab.
Count columns provide a count of returned rows for each unique Group By Column value (or a combination of values if multiple Group By columns are defined).
Script columns let you write custom JavaScript that evaluates the grouped data and returns an arbitrary value. To edit the script, click the column's  icon.
icon.
Interpretation and Operations
The interpretation dropdown lets you define how NIM interprets the data returned by the column. The available options for interpretation are text, numeric, date, boolean, and other.
The type of interpretation you select will change the options available to you in the operations dropdown. For example, the text interpretation lets you return the first value in the group, the last value in the group, or a comma-separated list of all values in the group with the concat option. The numeric interpretation lets you return the sum, average, min or max of the grouped values.
Note
The column’s data type must be compatible with the selected interpretation. For example, you cannot perform numeric operations on text data or interpret a date-time column as a Boolean value.
Sorting
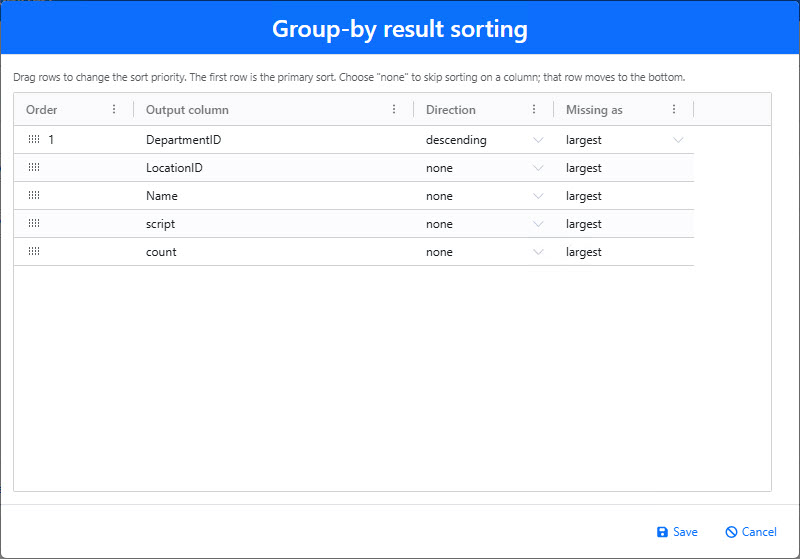
Data returned by a grouped filter can be sorted on any of the returned columns. To configure sorting, click the Sorting button to open the Group-by result sorting window.
The direction of sorting can be defined for each column in ascending or descending order. The priority of sorting can be configured by dragging and dropping columns in the desired order. If values are missing, they can be treated as either the largest or smallest values in the sorting order.